Sequences and Common Descent
How We Can Trace Ancestry Through Genetics
If you think you've found a problem in the following, please email me at welsberr at inia dot cls dot org. Organismal biology is my field, so I'd appreciate feedback from molecular biologists.
Some anti-evolutionists claim that sequence data from proteins and genetics
disprove the idea of common descent. Because humans evolved from primates,
who evolved from other mammals, who evolved from reptiles, who evolved
from amphibians, who evolved from fish, etc. back to bacteria, then supporting
data from sequence studies should show greater differences between humans
and bacteria than between fish and bacteria, according to those anti-evolutionists.

The data from sequencing the cytochrome-c protein across a few modern species shows that the pattern of differences does not fit that view. Instead, virtually the same distance from the sequence in modern bacteria exists to all modern metazoans. The anti-evolutionists would like you to believe that this poses a problem for the theory of common descent. I will endeavor to explain why they are mistaken.
So what does common descent actually imply for sequences? Can we really infer descent from the evidence of modern genetic or protein sequences? I will try to explain how sequence comparison works, and why making the inference of common descent on that evidence is reasonable.
Proteins are composed of chains of amino acids. Today, we can analyze a protein product to find out the sequence of amino acids that goes into it. The sequence of amino acids found in a protein is itself the result of the translation of another sequence, a sequence of bases in DNA. There are three bases in the DNA for each amino acid in the protein. This means that comparisons of DNA sequences are finer-grained than comparisons of protein sequences, and can resolve finer differences. The ability to derive sequences of DNA is a more recent development than being able to sequence a protein. One will find both kinds of analyses in the current literature.
We know that DNA is the primary means of passing inherited information from generation to generation (modulo some few others that utilize the related chemical system of RNA). Because proteins are constructed from the information in DNA, they also are reliable indicators of inherited information.
When we look at information in modern organisms, we can consider that the information that is present could be due to descent with modification, or due to "convergence". Convergence simply means that the same or similar sequence is found not because it derives from the same source, but rather because it serves the same function. I'll include in the "convergence" bin the arguments concerning "intelligent re-use". How can we distinguish between inheritance or descent on the one hand, and the various means of convergence on the other? One approach is to analyze those proteins or DNA sequences which can reasonably be inferred to have a history longer than the relationships that we intend to explore. That is, we want to analyze sequences of proteins or DNA that arose in the last common ancestor or earlier, not sequences of things that arose later than the last common ancestor. In terms used for other traits, we want a "primitive" rather than a "derived" protein or locus to examine. Later, we will look at some sequence comparisons of the cytochrome-c protein. The cytochromes are a class of proteins which serve in aerobic respiration. They are present in all aerobic organisms, including aerobic bacteria and humans. Because of the use of the same respiratory pathways across such widely divergent taxa, an inference of "convergence" strains credulity, whereas an inference of common descent accords well with the observed distribution of the trait. We infer that the presence of cytochrome-c in such widely disparate groups is due to its inclusion in a common ancestor.
But wait... If we have already inferred common descent from distribution data, what is left for sequence data to tell us? First, we can test our inference from distribution using sequence comparisons. An inference from distribution does not give us the level of confirmation that we would like; distribution of a trait indicates a likelihood of either common descent or convergence. Further refinement or refutation depends upon sequence analysis. Second, distribution of a single trait cannot resolve questions of order of splitting of lineages, whereas (with some limitations) sequence analysis can. When one uses many different traits, the distribution of those traits does allow for inference concerning order of splitting, but the distribution of one trait alone does not allow that.
How does a sequence come to be different over time? There are two basic types of differences that we can talk about, those that change the function of the protein product, and those which do not change the function of the protein product. By changing the function, I don't mean that one needs to change the function drastically, like changing a respiratory protein to one used in structure or locomotion. What I am saying is that function changes if the temperature of highest efficiency for the protein is shifted one way or the other, or if it has enzymatic function, that a change in the activation energy needed for a reaction changes, or other such changes occur in how well or under what conditions the protein works best. Changes in function tend to be either selected for or selected against in each species, so one can expect that such changes either spread to become commonplace or are eliminated from the population of that species. But what about changes that don't have effects on function? Because of the degenerate nature of the genetic code (a fancy way of saying that there are more codes than there are meanings), about one-fifth of all possible DNA point mutations result in exactly the same protein product being produced. Further, certain replacements of amino acids produce minimal changes in protein structure and function (some amino acids are more similar to one another chemically than others). That explains how we can have changes that don't make a difference; now how do we explain how such changes can become typical for a species rather than rare? The answer has to do with chance and sampling. Even without a fortuitous coupling of a neutral mutation with a selected-for trait, one can work out the math for reproduction in finite populations to find that, over time, it is likely that barring other mutations arising, a population will eventually come to have a reduced number of neutral alternate representations of the same genetic trait (alleles), and eventually only a single allele for the trait will be found in the population. There are some variances between math and reality; populations don't stop having mutations happen simply because the math is easier that way, for one. The interesting thing is that it is not certain that the allele that initially is more widespread will become the sole remaining allele. The likelihood is that a process of genetic drift will favor a more widespread allele, but there is the possibility that a rare allele will come to be widespread or the sole allele for the trait in question simply because of the action of chance. For a highly conserved protein product (one that doesn't show much change over time), the chances are that most changes that do happen will be of the neutral sort that don't change the function of the protein.
When looking at sequence comparisons, we are examining changes that have occurred in the inherited information that each organism receives, whether we come to a conclusion of common descent or convergence as a result. Because populations are made up of many organisms, it is possible that a protein or genetic locus is polymorphic: more than one protein or allele is present in the population. If we choose for analysis a protein or locus that has many different forms in one population, we will have a more difficult time figuring out what differences are significant between species because of all the differences we find within each species. Thus, we will tend to examine a protein or locus that tends to have a typical sequence for each species examined, rather than one that varies a lot within each species examined.
Now we've examined a variety of issues concerning sequences, including how sequences can come to change over time, the need for analysis of primitive sequences, and the preference for sequences to have a typical form for each species. Finally, it is time to look at what common descent really implies concerning sequences and comparisons.
Let's consider a hypothetical phylogenetic tree. Start with Species
A, which gives rise to Species B and Species C. If all three species live
to the present day and have sequences analyzed, what should we see? If
both Species B and C split off from A at the same time, all the species
would start accruing differences from the time of the split. Various empirical
and theoretical work indicates that such differences accrue at an approximately
constant rate, which is modulated by how tightly conserved the gene in
question is. Let's call the time since the split t_s, and the rate of difference
accrual for the gene being sequenced RD. The expected amount of change
in each species from the time of the split is t_s*RD. Since the three species
are reproductively isolated, changes in one generally cannot become incorporated
into any of the others. But we can't sequence the gene in Species A at
the time of the split; we are limited to sequencing its apparently little-modified
descendents in the present. What then is the expected difference between
Species A and either of its daughter species? Because our expected amount
of change is the same for all of these species from the time of the split,
the expected amount of difference between any two of them is going to be
the same as the expected amount of difference between any other pairing.
The actual amount of difference depends upon how often the same change
occurs in the separate lineages compared.

If we compare a variety of metazoan species to bacteria, what should we expect to find if common descent is true? Since the last common ancestor of modern bacteria and modern metazoans is putatively the same species, we should expect that the sequence differences between modern bacteria and any modern metazoan should be the same as the difference between modern bacteria and any other modern metazoan. See the illustration on "Comparison to Modern Bacteria".
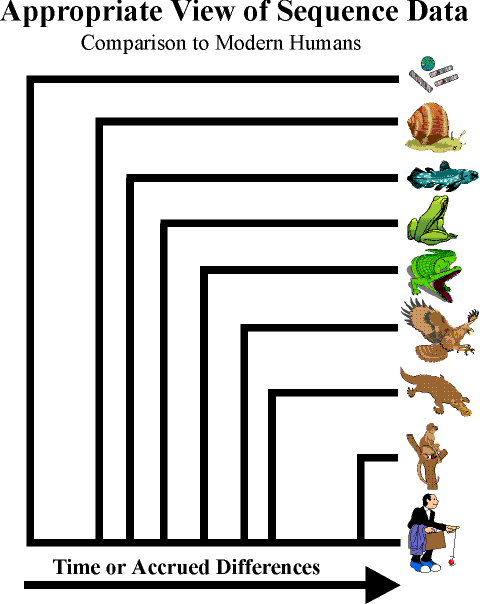
Now, if we think of a sequence that begins with Last Common Ancestor Q, which eventually gives us Modern Species A and Modern Species B. Let's say that the lineage that produces Modern Species B split about halfway between the time of LCA Q and the present, resulting in Modern Species C. Now analyzing the sequences of A, B, and C will not give us approximately equal difference values all the way around. If we compare to Species A, both B and C should show about the same amount of difference, since the lineage that gave rise to both split off at one time. However, if we compare A and B to Species C, then A should show about twice the amount of difference from C that B does, since Species A has had twice as long to acquire differences from Species C that Species B has had. Let's apply this to comparisons to modern humans.

If we obtain sequence differences between various species and modern humans, what should we expect to find? The differences in this case should relate to how long ago humans and the other species had an ancestor in common.
I've given the expectations, so now let's consider the data. This
data was put together by Jeff Otto, who noted, "The following data was
generated using the NRBF protein database and the UWGCG resource.
The analyses were performed using the FASTA program for sequence comparisons."
| Human | Chimp-
anzee |
Horse | Donkey | Mouse | Carp | Lamprey | Maize | Neuro-
spora |
S.
pombe |
Euglena | Tetra-
hymena |
|
| Human | -- | 100 | 88.5 | 89.4 | 91.3 | 78.6 | 80.8 | 66.7 | 63.7 | 67.3 | 56.6 | 47.5 |
| Chimpanzee | 100 | -- | 88.5 | 89.4 | 91.3 | 78.6 | 80.8 | 66.7 | 63.7 | 67.3 | 56.6 | 47.5 |
| Horse | 88.5 | 88.5 | -- | 99.0 | 94.2 | 81.6 | 84.6 | 63.7 | 65.7 | 71.2 | 58.6 | 46.5 |
| Donkey | 89.4 | 89.4 | 99.0 | -- | 95.2 | 82.5 | 85.6 | 64.7 | 65.7 | 72.1 | 58.6 | 46.5 |
| Mouse | 91.3 | 91.3 | 94.2 | 95.2 | -- | 83.5 | 84.6 | 66.7 | 65.7 | 71.2 | 56.6 | 48.5 |
| Carp | 78.6 | 78.6 | 81.6 | 82.5 | 83.5 | -- | 81.6 | 59.2 | 57.3 | 64.1 | 52.0 | 44.0 |
| Lamprey | 80.8 | 80.8 | 84.6 | 85.6 | 84.6 | 81.6 | -- | 59.2 | 59.2 | 68.3 | 55.6 | 48.5 |
| Maize | 66.7 | 66.7 | 63.7 | 64.7 | 66.7 | 59.2 | 59.2 | -- | 58.1 | 57.1 | 51.5 | 42.6 |
| Neurospora | 63.7 | 63.7 | 65.7 | 65.7 | 65.7 | 57.3 | 59.2 | 58.1 | -- | 70.8 | 57.6 | 45.5 |
| S. pombe | 67.3 | 67.3 | 71.2 | 72.1 | 71.2 | 64.1 | 68.3 | 57.1 | 70.8 | -- | 54.5 | 48.5 |
| Euglena | 56.6 | 56.6 | 58.6 | 58.6 | 56.6 | 52.0 | 55.6 | 51.5 | 57.6 | 54.5 | -- | 48.0 |
| Tetrahymena | 47.5 | 47.5 | 46.5 | 46.5 | 48.5 | 44.0 | 48.5 | 42.6 | 45.5 | 48.5 | 48.0 | -- |
As you can see, the proper expectations from common descent are well-supported by this sequence data. The distance from Tetrahymena to any of the other modern organisms is about the same, as the comparison to modern bacteria illustration indicated. And the distance from humans to other organisms also follows the expectations that were described in the comparison to modern humans illustration which was that phylogenies made from morphological and physiological analyses are supported by the sequence evidence.
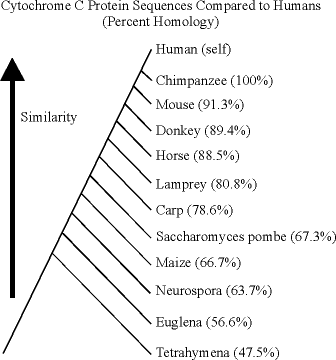
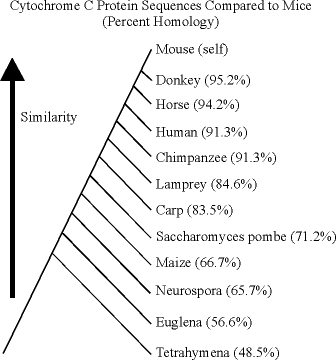
Here are two trees drawn from the data, one given relative to humans, and the other relative to mice.


Notice how these two agree closely from Lamprey through Tetrahymena. The two do produce one anomaly, which is that the comparison to humans suggests that humans shared a more recent common ancestor with mice than with the equids, while the comparison to mice suggests that the mice shared a more recent common ancestor with equids than with the primates. However, the percent homology difference in any of these is less than 5%. It would be foolhardy to try to make definitive statements about the last common ancestor of relatively closely related groups based upon the results of looking at one highly conserved protein. In order to resolve such differences, gene sequences should be compared for several different loci, including some that are not highly constrained and some that are relatively large. The cytochrome-c protein comparisons are pretty reliable for distinguishing between changes made at long time scales, not short ones.
More Information About Cytochrome-C Sequences
Dr. Laurence Moran provided some instructions for getting more cytochrome sequence data.
[Quote]
Go to the Pfam database at the Sanger Centre in Cambridge (UK). Here's the URL for the cytochrome c family,
http://www.sanger.ac.uk/cgi-bin/Pfam/getacc?PF00034
Click on the pull down menu that changes the alignment from "Seed Alignment" to "Full Alignement" then click on "Get alignment". You will be presented with an alignment of 259 cytochrome c's.
Information on the structure of the protein can be found at PDB (Protein Data Bank) at NCBI. Here's the URL for the horse protein,
http://www.pdb.bnl.gov/pdb-bin/opdbshort?oPDBid=1giw
There are links to here to another alignment and a phylogenetic tree at ProtoMap but the Java applets at this site may not work on all computers.
The FSSP database from EMBL (Heidelberg, Germany) is another good source of sequence alignements,
http://www.embl-heidelberg.de/cgi/qz?filename=/data/fssp/1ycc.fssp
Click on the alignment view menu to see "multiple alignment view (all sequences)" then display the results (hint: you have to select at least one of the sequences to see anything).
[End Quote - L Moran, Message-ID <7FV566$232$1@BIOINFO.MED.UTORONTO.CA>]
The sequences for proteins are listed in a one-letter code. Unfortunately, it can be difficult to find such basic information as "What does this letter represent?" on these bioinformation servers. Here is a link to a page that gives both the canonical genetic code and the protein single-letter code meanings.


